
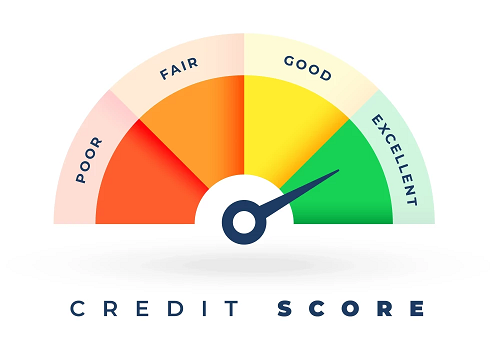
Credit rating exercises undertaken by banks and external credit rating agencies play a significant role in determining a business's ability to borrow and the cost of borrowing. These ratings are influenced by various factors such as industry risk, government policy, market position, operating efficiency, financial risk, and management evaluation. Among these, financial risk carries the most weight. Here, we will explore key financial indicators that professionals and entrepreneurs should focus on to influence their credit ratings positively.

What is Total Outside Liability to Total Net Worth (TOL/TNW)?
TOL/TNW measures a company's financial leverage by dividing total liabilities by total net worth (sum of share capital and surplus reserves). A low ratio indicates a high promoter stake and is considered less risky. Businesses with a TOL/TNW of less than 1 score the highest points, while a ratio of more than 3 scores no points. Ideally, businesses should maintain a TOL/TNW ratio between 1-2.
How Does the Current Ratio Affect Liquidity?
The Current Ratio assesses a business's liquidity by dividing total current assets by total liabilities. This ratio indicates the business's ability to repay short-term obligations. A current ratio above 1.5 implies sufficient cash flow, while below 1 signals potential cash flow problems. In credit rating exercises, a ratio above 1.5 scores the highest points, and businesses should aim for a current ratio between 1.35 - 1.20.
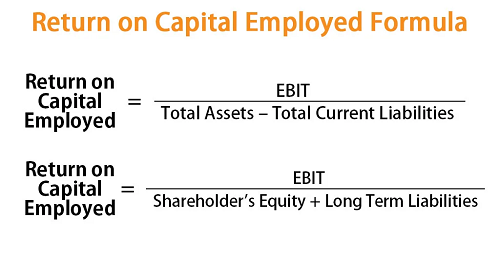
Why is Return on Capital Employed (ROCE) Important?
ROCE measures profitability and efficiency by dividing profit before depreciation, interest, and tax (PBDIT) by total capital employed (total assets minus current liabilities). A high ROCE indicates efficient capital use, while a low ROCE suggests inefficiency. Ideally, businesses should maintain a ROCE above their borrowing costs. Companies with ROCE above 20% score highest in ratings, while those below 2% score lowest. A target ROCE range is 15% - 5%.
What Does Retained Profit to Total Assets (RPTA) Indicate?
RPTA evaluates profitability by comparing retained profits to total assets. High RPTA indicates minimal need for external financing, while low RPTA suggests the opposite. Businesses with RPTA above 7.5% score the highest, while those below 1% score lowest. An ideal RPTA range is 5% to 3%.
What does Profit Before Depreciation, Interest, and Tax to Interest Expense (PBDIT/INT) indicate?
The PBDIT/INT ratio, or interest coverage ratio, measures how many times a business can cover interest payments with its earnings. A ratio below 1 signals potential difficulties in meeting interest obligations, while a ratio above 2 is more comfortable. Ratios above 8 score highest, and below 1 score lowest. Businesses should aim for a PBDIT/INT ratio above 2.
Why is Profit After Tax to Net Sales (PAT/Net Sales) Crucial?
PAT/Net Sales is a stringent profitability measure that accounts for tax payments. A ratio above 8% indicates excellent financial performance and scores highest, while below 2% scores lowest. Businesses should aim for a PAT/Net Sales ratio between 6% - 3%.
How Does Net Cash Accrual to Total Debt (NCA/TD) Affect Coverage?
The NCA/TD ratio assesses a business's ability to cover total debt with yearly cash accruals (profit after tax plus depreciation minus dividends). Higher ratios provide better lender coverage. Ratios above 20% score highest, while below 4% score lowest. Businesses should target an NCA/TD ratio between 18% - 8%.
What is the Importance of Average Growth in Net Sales?
Average growth in net sales over a period indicates company performance. Growing businesses have better prospects and lower financial risk. Rating models award highest points to businesses with over 15% sales growth and penalize declining sales. An ideal growth rate is between 15% - 3%.
Understanding and improving these financial indicators can significantly influence a business's credit rating, enhancing borrowing ability and reducing costs.











 CAclubindia