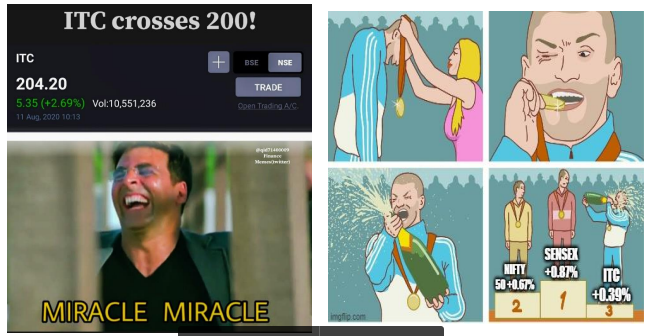
In the social media-driven age, most of us would have come across memes relating to the stock of ITC Limited.

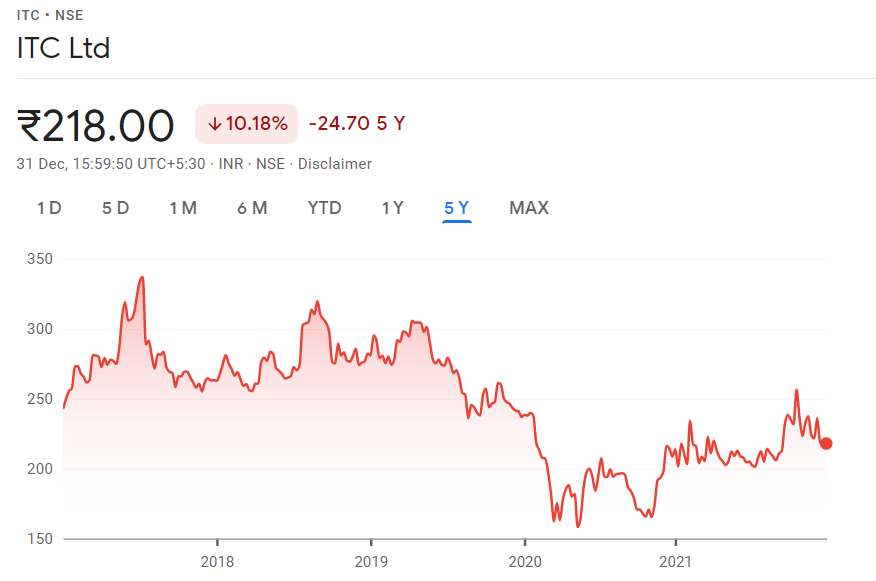
These are mainly fuelled by the fact that despite being one of the favourite stocks of the fundamental analysts, the stock price has been relatively flat as compared to the market as a whole. Here is the price of the stock in the last 5 years.

Source: Google Finance
As it can be seen, the stock stood at Rs 242.70 on 6 Jan 2017 and is currently priced at Rs 218. So if instead of buying ITC cigarettes in 2017, one would have invested in ITC stock, they would have lost money.

Here is a side-by-side comparison against Sensex.
|
Date |
Sensex |
ITC |
|
06-Jan-17 |
26,759.0 |
242.7 |
|
31-Dec-21 |
58,253.0 |
218.0 |
|
CAGR |
21.47% |
-2.65% |
Interestingly, ITC is one of the constituents of Sensex.
But do these numbers reflect the returns which are being earned by the ITC investors?
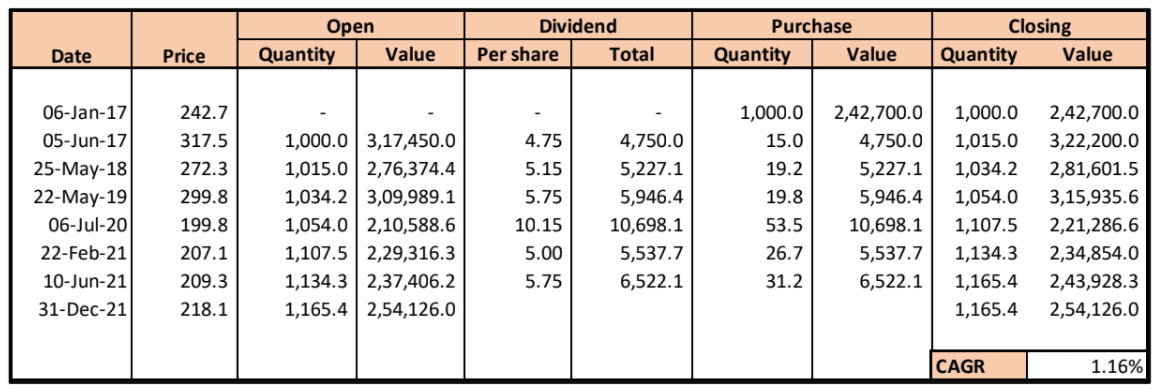
The answer is a definite no. ITC has been regularly paying dividends to its shareholders and these are not being reflected in its price. Here is an attempt to include those dividends in the calculation of the returns.

Here, working on the assumption that whenever the dividend is received, the investor invests that amount in the shares of ITC itself, the CAGR comes to be approximately 1.16% p.a. Although a positive return, this can hardly be called a desirable return in a country where the inflation is 4-6% and the Sensex has given a return of ~21.50% p.a. in the same period. Of course, this analysis is prone to criticism due to the reinvestment assumption and impracticality due to fractional shares, but still, it can provide an approximate true return for the stock.
The question remains then, why is the stock still one of the favourites of the analysts? The answer would dwell in the fundamentals of the company. So let's journey into the numbers of the company.
|
Year |
2021 |
2020 |
2019 |
2018 |
2017 |
|
Consolidated (In Cr) |
|||||
|
Total revenue |
51,905.3 |
52,001.9 |
50,526.5 |
45,280.8 |
44,538.1 |
|
Operating Profit |
17,002.7 |
19,260.2 |
18,406.4 |
16,483.0 |
15,435.9 |
|
PAT Before x/o |
13,389.8 |
15,584.6 |
12,824.2 |
11,485.1 |
10,471.3 |
|
Net Profit |
13,161.2 |
15,306.2 |
12,592.3 |
11,271.2 |
10,289.4 |
|
Operating Cash Flow |
12,527.1 |
14,689.7 |
12,583.4 |
13,169.4 |
10,627.3 |
|
Ratios |
|||||
|
RoA % |
17.8% |
19.8% |
17.5% |
17.5% |
18.4% |
|
ROE % |
21.8% |
23.4% |
21.3% |
21.5% |
22.2% |
|
EBIT Margin % |
36.5% |
40.9% |
39.7% |
39.3% |
37.5% |
|
Net Profit Margin % |
27.2% |
31.5% |
26.5% |
26.4% |
24.5% |
|
Dividend Payout to NP % |
46.7% |
46.1% |
49.9% |
51.2% |
66.5% |
|
Cash Flow to NP ratio |
95.2% |
96.0% |
99.9% |
116.8% |
103.3% |
Source: Trendlyne
The company checks the important boxes of stable revenue growth, margins and returns. The operating cash flows have been stable and have been in line with the net profits of the company, further strengthening the fundamentals. Further, the company has been paying roughly half of its profits as dividends to the shareholders. These numbers do not justify the tepid return which the company has been providing to its investors, and hence we move on to analysing the segments of the company.
Segment 1 - Cigarette Business
|
Year |
2021 |
2020 |
2019 |
2018 |
2017 |
|
Cigarette (in Cr) |
|||||
|
Revenue (External) |
22,557.3 |
23,679.1 |
22,913.3 |
24,848.1 |
35,877.7 |
|
Results |
13,498.4 |
15,838.5 |
15,411.8 |
14,128.1 |
13,203.7 |
|
Capex |
98.9 |
138.9 |
171.4 |
96.2 |
262.4 |
|
Total Revenue |
52,835.2 |
50,968.5 |
49,348.4 |
47,362.5 |
58,288.0 |
|
Total Results |
16,348.1 |
18,843.4 |
18,198.5 |
16,454.0 |
15,341.8 |
|
Result Margin |
59.84% |
66.89% |
67.26% |
56.86% |
36.80% |
|
Capex as % of Revenue |
0.44% |
0.59% |
0.75% |
0.39% |
0.73% |
|
Share in revenue |
42.7% |
46.5% |
46.4% |
52.5% |
61.6% |
|
Share in results |
82.57% |
84.05% |
84.69% |
85.86% |
86.06% |
The segment is one of the major contributors to the top-line and the most important contributor to the bottom-line. It has a share of 40-50% in the sales and 80-85% share in the profits. Further, the capex is minimal and hence it is the most important cash-generating unit for the company.
Segment 2 - FMCG
|
Year |
2021 |
2020 |
2019 |
2018 |
2017 |
|
FMCG (in Cr) |
|||||
|
Revenue (External) |
14,737.1 |
12,844.0 |
12,517.1 |
11,339.3 |
10,523.6 |
|
Results |
838.0 |
424.9 |
325.6 |
170.5 |
26.2 |
|
Capex |
478.4 |
859.9 |
1,324.9 |
835.9 |
1,157.4 |
|
Total Revenue |
52,835.2 |
50,968.5 |
49,348.4 |
47,362.5 |
58,288.0 |
|
Total Results |
16,348.1 |
18,843.4 |
18,198.5 |
16,454.0 |
15,341.8 |
|
Result Margin |
5.69% |
3.31% |
2.60% |
1.50% |
0.25% |
|
Capex as % of Revenue |
3.25% |
6.69% |
10.58% |
7.37% |
11.00% |
|
Share in revenue |
27.9% |
25.2% |
25.4% |
23.9% |
18.1% |
|
Share in results |
5.13% |
2.26% |
1.79% |
1.04% |
0.17% |
It can be easily inferred that the FMCG segment is a developing segment. Although it contributes
20-25% in the revenue, the contribution to the profits has been minimal. However, it is also true that this contribution is getting more significant in recent years than earlier ones. Further, the profit margin has been improving over the years. This segment is clearly where the focus of the company has been concentrated towards.
Segment 3 - Hotels
|
Year |
2021 |
2020 |
2019 |
2018 |
2017 |
|
Hotels (in Cr) |
|||||
|
Revenue (External) |
659.8 |
1,911.6 |
1,728.2 |
1,480.0 |
1,400.4 |
|
Results |
-563.9 |
154.0 |
185.7 |
185.7 |
117.1 |
|
Capex |
409.5 |
857.4 |
936.5 |
918.6 |
472.2 |
|
Total Revenue |
52,835.2 |
50,968.5 |
49,348.4 |
47,362.5 |
58,288.0 |
|
Total Results |
16,348.1 |
18,843.4 |
18,198.5 |
16,454.0 |
15,341.8 |
|
Result Margin |
-85.47% |
8.06% |
10.75% |
12.55% |
8.36% |
|
Capex as % of Revenue |
62.07% |
44.85% |
54.19% |
62.07% |
33.72% |
|
Share in revenue |
1.2% |
3.8% |
3.5% |
3.1% |
2.4% |
|
Share in results |
-3.45% |
0.82% |
1.02% |
1.13% |
0.76% |
Hotels have to be one of the weaker segments for the company. While the cigarette segment was a cash-generating unit, the hotel segment compensates for the same by being a cash-burning unit. The segment has plenty of reg flags, including that the margins have been low and irregular, capex has been more than the results for the segment and overall contribution to revenue and results has been negligible.
Segment 4 - Agri-Business and Segment 5- Paperboards, Paper and Packaging
|
Year 2021 2020 |
2019 |
2018 |
2017 |
|
Agri Business (in Cr) |
|||
|
Revenue (Total) 12,882.7 10,453.9 |
9,565.4 |
8,155.0 |
8,384.9 |
|
Revenue (Internal) 4,880.8 4,541.3 |
3,490.1 |
3,680.8 |
3,070.7 |
|
Total Results 918.2 829.7 |
793.4 |
841.5 |
926.3 |
|
Internal Revenue as % of |
|||
|
total revenue 37.9% 43.4% |
36.5% |
45.1% |
36.6% |
|
Paperboards, Paper and Packaging (in Cr) |
|||
|
Revenue (Total) 5,618.6 6,107.2 |
5,860.2 |
5,249.6 |
5,362.9 |
|
Revenue (Internal) 1,068.7 1,608.2 |
1,629.8 |
1,554.2 |
1,630.2 |
|
Total Results 1,098.7 1,305.3 |
1,239.2 |
1,042.2 |
965.8 |
|
Internal Revenue as % of |
|||
|
total revenue 19.0% 26.3% |
27.8% |
29.6% |
30.4% |
Agribusiness and paperboards segment contribute a healthy portion of their sales in form of internal revenue, i.e. transfer of output to other segments, to be used as inputs in those segments, leading to vertical integration. These segments are supporting the other segment and their performance cannot be measured in isolation as they are providing synergies to the overall performance of the company.
Segment 6 - Others
Includes ITC Infotech, which provides Information technology services and solutions. Since no major revenue is derived from the segment, no further analysis has been made.
Inferring the segment data
ITC can easily be classified as a conglomerate with separate business verticals. This brings in the negative impact of conglomerate discount where markets tend to value a group of business verticals lower than the sum of the individual value of these verticals.
(Disclaimer: Although I have kept the discussion as objective as I could, the discussion below will also include bits of opinion and hence the reader may disagree with those. Feel free to comment your opinion regarding the same.)
There are a couple of reasons why the conglomerate discount may apply to ITC –
- The company has been shifting its focus from the high margin cigarette business to the lower margin FMCG business. We will discuss the reasons for the same in the next section. FMCG’s share in revenue and profits have been increasing, despite posting much lower margins than the cigarette business. Its also worthwhile to mention here that the cigarette business can be characterised by consumer stickiness, while the same cannot be said for the FMCG business.
- From the tables above, it can be easily inferred that the cash generated by the cigarette business is being utilised for capital expenditure for the FMCG business and the much less impressive hotel business. Although FMCG business covered for its capex in 2021, the hotel business continues to rely on the other verticals to meet its capex requirements.
Now the first point begs another question, why is the company shifting its focus from a moat cigarette business to a much nascent FMCG business. Despite its high margins and consumer stickiness, the cigarette business has a few inherent flaws which have been discussed further
- ESG Concerns- There has been a rise in ESG investing, where the investments are made taking in mind the Environmental, Social and Corporate Governance factors while evaluating the overall business of the company. The cigarette business doesn’t quite tick these boxes as tobacco is highly addictive and injurious to health and is generally looked down upon as a negative element in society. This has led to lower PE ratios for tobacco stocks worldwide and the ITC stock has also been impacted by the same.
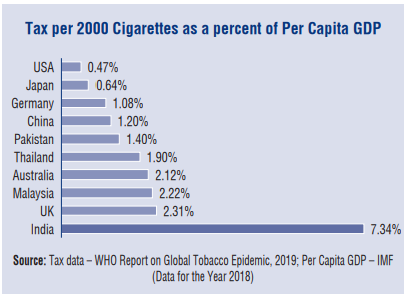
- Tobacco Industry in India- The taxation on cigarettes in India has been a bane to the growth of the industry. Taxes on cigarettes are one of the highest in India-

(Source: Annual Report 21)
This has led to the development of lightly taxed and illegal (tax evaded) tobacco products such as chewing tobacco, gutka and bidi. Share of legal cigarettes in total tobacco consumption has declined from 21% in 1981-82 to a mere 9%, aggregate tobacco consumption in the country has increased over the same period.
India is currently the 4th largest illicit cigarette market globally.
The way forward?
It has often been speculated that the company can unlock its true value by demerging its businesses into separate businesses. However, the management has not provided any concrete timeline or plans for the same and these speculations will continue to remain as such for the time being.
ITC derives significant synergies from the vertical integration of Agri, Cigarettes, FMCG and Paperboard business and this will always land doubts on the possible demerger of the businesses.
To conclude, while the stock continues to perform strongly in the books and numbers, the price is yet to break out of its “comfort zone” and unless major restructuring is done, the price is likely to continue to bounce in the current zone itself.
Disclaimer- Not invested directly.
The author is a practicing Chartered Accountant with a keen interest in stock market and can be reached out at shubham.singhal@capksinghal.


 CAclubindia
