They typically involve multiple departments, complex workflows, regulatory considerations, and tight timelines.
To navigate this complexity, businesses need smart and reliable project management tools-and one of the most effective and visually intuitive among them is the Gantt chart. In this article, we'll explore what a Gantt chart is, why it's particularly well-suited for financial transformation projects, and how to implement it successfully in your organization.

What Is a Gantt Chart and Why Should You Care?
At its core, a Gantt chart is a visual timeline that maps out tasks, deadlines, and dependencies within a project. Each activity is represented as a horizontal bar spanning its start and end dates. These bars are arranged along a calendar axis, allowing teams to easily track progress and identify potential delays.
Unlike traditional to-do lists or spreadsheets, a Gantt chart gives you a bird's-eye view of the entire project. This not only enhances visibility but also strengthens communication across different levels of the organization.
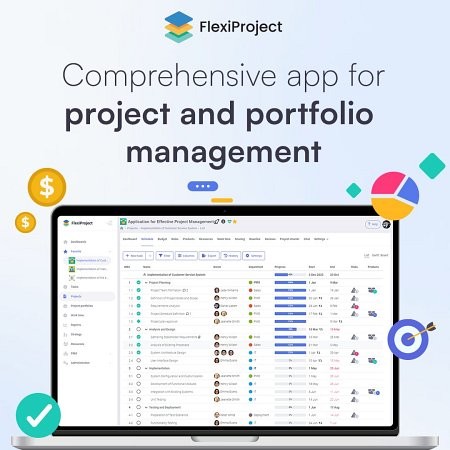
Learn how to create a Gantt chart with real examples at Gantt chart – FlexiProject

The Role of Gantt Charts in Financial Transformation
Financial transformation initiatives often span several months and involve tasks such as:
- Conducting internal audits
- Overhauling outdated accounting systems
- Implementing ERP or AI-based tools
- Revising budgeting and forecasting frameworks
- Upskilling finance teams
- Aligning compliance with evolving regulations
Given their scope and complexity, these projects require structured, agile, and adaptable planning. This is where Gantt charts become invaluable.
Let's look at four key reasons why Gantt charts are essential for financial transformation:
1. Clarity and Visualization of Transformation Milestones
A financial transformation roadmap can be overwhelming, especially when it involves dozens of moving parts. A Gantt chart breaks it all down into clear, manageable phases. Whether you're auditing current systems or deploying new technology, every milestone can be defined, visualized, and tracked on the chart.
This visual approach fosters better understanding and commitment from stakeholders at all levels-from CFOs to implementation teams.
2. Proactive Risk Management
Every transformation project carries risk-missed deadlines, scope creep, resource bottlenecks, and more. Gantt charts help identify critical paths-sequences of tasks that directly impact the project's completion timeline.
By highlighting these dependencies, Gantt charts allow managers to anticipate risks early and act decisively to resolve potential issues. This is particularly helpful in the high-stakes environment of financial transformation, where delays can lead to regulatory penalties or budget overruns.
3. Improved Cross-Functional Collaboration
A financial transformation project doesn't happen in a vacuum. It involves finance, IT, HR, legal, procurement, and C-suite leadership. Gantt charts serve as a central communication hub, aligning these diverse teams around a single project vision.
When everyone can see what's happening, when it's happening, and who's responsible, collaboration becomes smoother. Miscommunications and duplicated efforts are minimized, improving overall project cohesion.
4. Continuous Monitoring and Adaptability
Long-term projects must adapt to change-whether due to shifting business priorities, new legislation, or emerging technology. Gantt charts are dynamic by nature. They can be updated in real-time to reflect new deadlines, updated responsibilities, or revised deliverables.
This adaptability enables ongoing progress monitoring, ensuring that the project stays on track and aligned with broader business goals.

When and How to Implement a Gantt Chart
You might be wondering: Is a Gantt chart suitable for every type of financial transformation?
The short answer: Yes-especially when the project involves:
- Multiple interrelated tasks
- Strict time and budget constraints
- Teams from different departments
- A need for real-time updates and visibility
It's best to introduce the Gantt chart during the project planning stage-before operational tasks begin. This allows teams to establish a realistic, achievable schedule and to assess the feasibility of each phase. From there, the chart becomes a living document that evolves with the project.
To get started, choose a platform that supports Gantt chart creation (many modern project management tools do), or explore a dedicated solution such as Flexi-Project.com, which offers tailored functionality for dynamic business environments.

Real-World Example: Implementing ERP in a Finance Department
Consider a mid-sized organization planning to replace its outdated accounting system with a cloud-based ERP. The transformation involves:
- Gathering requirements from finance and procurement
- Selecting and customizing the ERP software
- Data migration and testing
- Staff training and process documentation
- System go-live and post-implementation review
Each of these phases has its own set of tasks, responsible team members, and deadlines. A Gantt chart can map these out in detail, ensuring that no step is overlooked and that progress is continuously monitored.
Final Thoughts: Why Every Financial Leader Needs a Gantt Chart
In a world where time is money and precision matters, financial transformation demands more than ambition-it requires methodical execution. Gantt charts offer a structured, visual way to navigate the uncertainty of change while ensuring clarity, accountability, and momentum.
Whether you're rolling out a new finance system, restructuring operations, or adapting to global reporting standards, incorporating a Gantt chart into your transformation toolkit can significantly increase your chances of success.
By providing real-time visibility, aligning teams, and flagging critical issues early, Gantt charts enable leaders to turn strategic financial visions into operational realities.

For more project management tools and insights, visit Flexi-Project.com.


 CAclubindia
