The BSE-Sensex has been trading in the range of 16,000 to 18,000 for almost a year now. It is only in the past few trading session that it has managed to stay above the 18,000 mark. However, purely going by valuations, the general consensus is that the markets seem overvalued. And it has remained in the ‘slight expensive' zone over the past year as well. Hence, the rangebound movement in the index.
But what does this indicate for the midcap stocks, whose representative index (the BSE-Midcap Index) is benchmarked against the BSE-Sensex?
Below we have displayed a comparative data for both the indices - BSE-Sensex and BSE-Midcap index.
 |
|
|
|
|
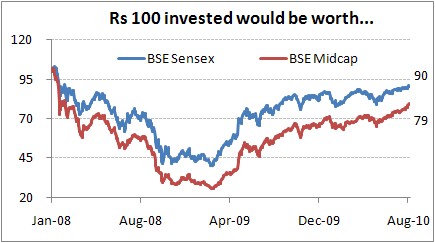
If one had invested Rs 100 at the beginning of 2008 in the BSE-Sensex and the BSE-Midcap indices each, it would have been worth Rs 90 and 79 respectively. This indicates that the Sensex has outperformed the BSE-Midcap Index over this two and a half year period. However, the BSE-Midcap Index has by far outperformed the BSE-Sensex over the last year as well as during the year till date (YTD; January 1 2010 to August 24 2010). While the BSE-Sensex has risen by 17% over the last year, the BSE-Midcap Index has risen by 37%. As for the YTD comparison, the BSE-Sensex is up by 5%, while the BSE-Midcap Index is up by 17%.
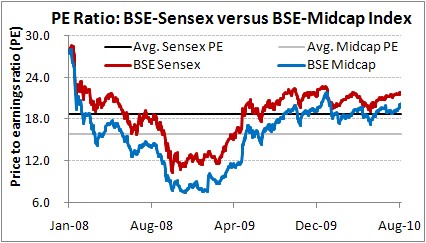
However, the best way to gauge the attractiveness of midcap stocks is to look at their price to earnings ratio (PE). A batter way to gauge the same is by comparing the valuations of the BSE-Midcap Index with the benchmark index, the BSE-Sensex.
Below is a chart indicating the PE ratios of both the indices since 2008. We have also shown the average PE ratios of both these indices during this two and a half year period (prior period data was not available at this time). While there is no doubt that the BSE-Midcap Index would trade at lower valuations as compared to the BSE-Sensex (for its own set of reasons), the main question is that despite this, are midcaps attractive at this point in time?
 |
|
|
|
|
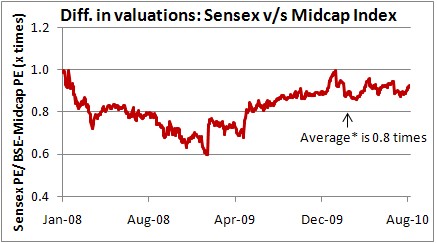
We shall look at the next chart to find out. Below is a chart displaying the difference in valuations over this period. We have calculated the same by dividing the PE ratio of the BSE-Sensex by the BSE-Midcap Index.
What does this convey? Well, as the ratio moves towards the 1 times mark, this means the difference in the PE ratios of the two indices is less. This could mean two things - Either that the Sensex is undervalued or that midcaps are expensive.
 |
|
|
|
|
Similarly, when the ratio drifts away from the 1 times mark, this could indicate that the BSE-Sensex is expensive or that the midcap stocks look fairly attractive.
What does it seem like at this point in time?
Well, considering that the BSE-Sensex is trading at a price to earnings of about 21.8 times, it seems to be a tad on the expensive side (as compared to its long term average valuation of about 16 to 17 times). With this, the BSE-Midcap Index's valuations seem to be quite close to the 1 times mark, indicating that midcaps (as a whole) also seem to be on the ‘not so attractive side'.
The Most Profitable Approach To Stock Picking
Get this exclusive guide FREE!


 CAclubindia
