What is the Gross Domestic Product?
Gross domestic product (GDP) is a monetary measure of the market value of all the final goods and services produced in a specific time period, often annually. The Gross Domestic Product measures the value of economic activity within a country.The growth rate of real GDP is often used as an indicator of the general health of the economy. In broad terms, an increase in real GDP is interpreted as a sign that the economy is doing well.
How is GDP Calculated?
There are 3 methods or formulae by which GDP can be determined. All the 3 methods have been shown by way of a tabular presentation as shown below:

|
Expenditure Approach |
Income Approach |
Production or Value-Added Approach |
|
This is the most commonly used GDP formula, which is based on the money spent by various groups that participate in the economy Components of GDP by expenditure Approach GDP (Y) is the sum of consumption (C), investment (I), government spending (G) and net exports (X - M). Y = C + I + G + (X − M) C is normally the largest GDP component in the economy, consisting of private expenditures in the economy (household final consumption expenditure) I: Capital Investment spending G is the sum of government expenditures on final goods and services. It includes salaries of public servants, purchases of weapons for the military and any investment expenditure by a government. It does not include any transfer payments, such as social security or unemployment benefits. X: Exports of Goods and Services M: Imports of Goods and Services |
GDP is the sum of the incomes earned through the production of goods and services. Components of GDP by Income Approach Only those incomes that are come from the production of goods and services are included in the calculation of GDP by the income approach. 3) Income not declared to the tax Authorities i.e. Shadow Economy |
Value added is the increase in the value of goods or services as a result of the production process Components of GDP by Production or Value Added Approach Value added = value of production - value of intermediate goods 1) By multiplying the output of each sector by their respective market price and adding them together 2) By collecting data on gross sales and inventories from the records of companies and adding them together The value of output of all sectors is then added to get the gross value of output at factor cost. Subtracting each sector's intermediate consumption from gross output value gives the GVA (=GDP) at factor cost. |
In India, contributions to GDP are mainly divided into 3 broad sectors - agriculture and allied services, industry and service sector. In India, GDP is measured as market prices and the base year for computation is 2011-12. GDP at market prices = GDP at factor cost + Indirect Taxes - Subsidies
India's economy contracted by 23.9 per cent in April-June -- the worst performance since quarterly measurement began in 1996 and probably the first contraction since 1980.
The lockdown and the consequent suspension in economic activities due to the pandemic were so massive that among a mix of advanced and emerging economies, India's GDP contraction in Q1 FY21 was the worst.
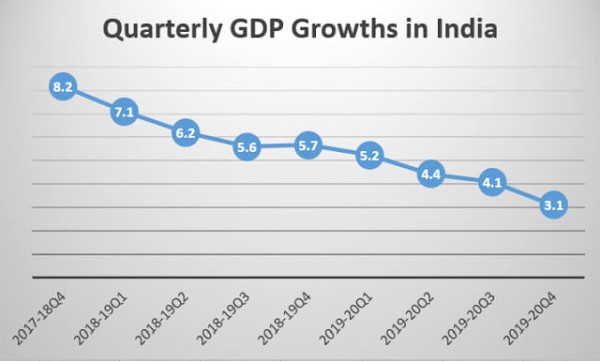
According to the latest release, the GDP at Constant (2011-12) Prices in Q1 of 2020-21 is estimated at Rs 26.90 lakh crore. This value was Rs 35.35 lakh crore in Q1 of 2019-20. Hence, the Indian economy has experienced a contraction of 23.9% as compared to 5.2% growth in Q1 2019-20.
While the GDP at Current Prices in the year Q1 2020-21 is estimated at Rs 38.08 lakh crore. This value was Rs 49.18 lakh crore in Q1 2019-20. Hence, it showed a contraction of 22.6% as compared to 8.1% growth in Q1 2019-20.
Key highlights from the Q1 FY21 GDP numbers:
1) The 'real' or inflation-adjusted gross domestic product (GDP) contracted 22.6 percent in the April-June quarter this fiscal.
2) Barring the agriculture sector that grew 3.4 percent, all others were in the red.
3) Manufacturing, mining and construction contracted 39.3 percent, 23.3 percent and 50.3 percent respectively.
4) Trade, hotels, transport, communication and services related to broadcasting contracted 47 percent in the first quarter of 2020-21
5) The real estate sector, along with financial and professional services, shrank 5.3 percent in April-June 2020.
Reasons to Worry
If GDP growth falls again in the current quarter (July-September), India would technically be in a recession, an economic state characterised by at least two successive quarters of contraction.India was in a recession last in 1979 when the real GDP fell 5.2 percent.

According to my understanding, the contraction is not alone due to COVID. Even before the pandemic struck, the Indian economy was experiencing a slowdown as it grew at 4.2 percent in FY20.Most of the announcements made so far, attempt at restarting the economy with reforms on the supply side. Former NITI Aayog Vice-Chairman Arvind Panagariya stated on August 8 that the nation is going to possibly require 'a little bit of stimulus' on the demand side as the country's economic activity begins to expand.
Pronab Sen, former chief statistician of India said the Q1 GDP data doesn't capture the whole extent of the damage that the lockdown did to the economy. He said that this data sample includes data from only the larger companies that were affected due to the lockdown and not the unlisted and smaller companies. According to State Bank of India's research report - Ecowrap it has been estimated Q2 real GDP decline in the range of (-) 12 percent to (-) 15 percent, while Q3 GDP is seen between (-) 5 percent and (-) 10 percent. Q4 is expected to be in (-) 2 percent to (-) 5 percent range.
Also Read:


 CAclubindia
