Whether you are a simple investor, or a decision maker in a company, the ability to understand the performance of a company by analyzing the financial data is a mighty useful skill to have.
A Financial statement is a summary of the financial performance of a company. The three main reports in a financial statement are the Balance Sheet, Income Statement and the Cash Flows statement.
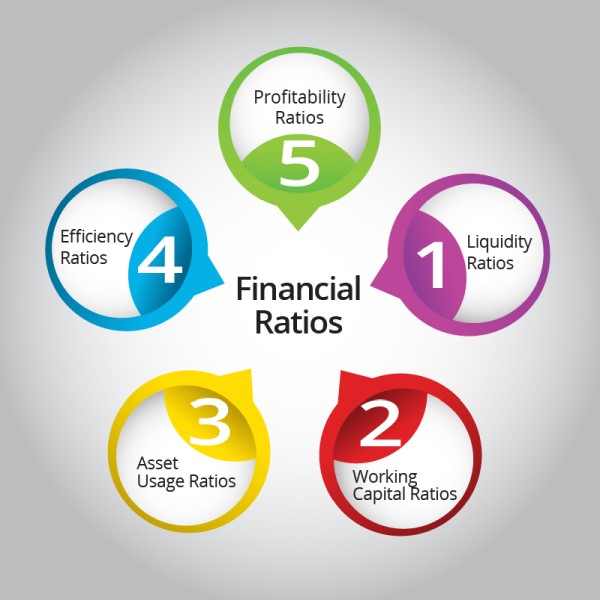
One excellent way of analyzing a financial statement is through financial ratios. A ratio is quite simply, dividing an item with another.
For example, Gross Profit Margin is calculated by dividing gross profit by net sales. There are different types of ratios that help one measure the profitability, liquidity, debt, operating performance, cash flow performance and investment valuation of a company.
There are a number of published ratio benchmarks that will help you understand if a particular ratio is red, green or amber. For example, the Debt Ratio is helpful in assessing the ability of a firm to pay back long - term debts.
Debt ratio = Liabilities/Assets
The normal benchmark for debt ratio is 0.6-0.7.The higher the number, the higher is the debt. So you know that if the number is very different from the benchmark, you got to take a closer look.
Another important approach to understand the performance of a business over time is 'Trend Analysis'. By analyzing the movement of the same financial information over multiple periods, may give you important signals – whether the revenue is growing over the past period of reporting, whether costs are going up or down, whether debt is going up or down etc.
Comparing the financial performance of a company against its peers is another very useful indicator of relative performance.
If you are examining financials data for just one period, 'Vertical Analysis' works best. The main advantage of vertical analysis is that the information of two companies can be compared irrespective of their sizes.
The following simple example from Investopedia drives home the point:
Suppose XYZ Corp has three assets: cash and cash equivalents(worth $3 million) , inventory(worth $8 million) , and property(worth $9 million) .
If vertical analysis is used, the asset column will look like:
Cash and cash equivalents: 15%
Inventory: 40%
Property: 45%
By knowing how to examine a financial report, you will gain good understanding of the general trends and performance of a business.
The author can also be reached at kganeshan@gmail.com


 CAclubindia
