
by Justin Kuepper,
Island Reversal Patterns
Island reversals are strong short-term trendreversal indicators. They are identified by a gap between a reversal candlestick and two candles on either side of it. Here are two examples that occurred on the chart of Doral Financial (DRL).

Figure 1
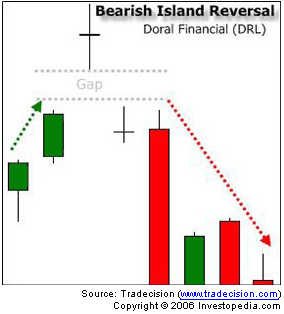
Figure 2
Here are some important things you need to consider when using this pattern:
Island reversals can also occur in "clusters" - that is, in a multi-candle reversal pattern, such as an engulfing, as opposed to a single candle reversal. Clusters are easier to spot, but they often result in weaker reversals that are not as sharp and take longer to occur.
Hook Reversal Patterns
Hook reversals are short- to medium-term reversal patterns. They are identified by a higher low and a lower high compared to the previous day. Figures 3 and 4 are two examples that occurred on the chart of Microsoft Corp. (MSFT).

Figure 3
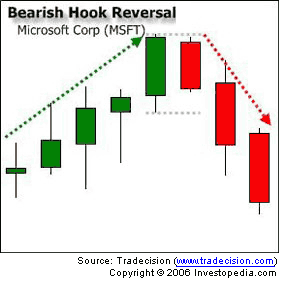
Figure 4
There are several important things to remember when using this pattern:
San-Ku (Three Gaps) Patterns
San-ku patterns are anticipatory trend reversal indicators. In other words, they do not indicate an exact point of reversal; rather, they indicate that a reversal is likely to occur in the near future. They are identified by three gaps within a strong trend. Here is an example that occurred on the chart of Microsoft Corp. (MSFT).
Here are some important things to remember when using this pattern:

Figure 5
Kicker Patterns
Kicker patterns are some of the strongest, most reliable candlestick patterns. They are characterized by a very sharp reversal in price during the span of two candlesticks. Here's an example that occurred on the Microsoft (MSFT) chart.
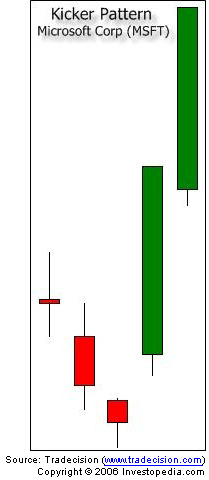
Figure 6
Here are some important things you need to remember when using this pattern:
Using Gaps with Candlesticks
When gaps are combined with candlestick patterns and volume, they can produce extremely reliable signals. (For further reading, see Playing The Gap.) Here is a simple process that you can use to combine these powerful tools:
Attempting to play reversals can be risky in any situation because you are trading against the prevailing trend. Do make sure that you keep tight stops and only enter positions when trades meet the exact criteria. (To learn more, see Retracement Or Reversal: Know The Difference.)
Conclusion
Now you should have a basic understanding of how to find reversals using advanced candlestick patterns, gaps and volume. The patterns and strategies discussed in this article represent only a few of the many candlestick patterns that can help you better understand price action, but they are among the most reliable. For further reading, see The Art Of Candlestick Charting - Part 1, Part 2, Part 3 and Part 4.
Menu
Candlestick Charting....!!!!!


Recent Topics :
- GST applicability on own-vehicle goods transportat
- FAST DS Scheme 26
- 12A registration expired in FY 22-23 and is not re
- Seeking Clarification on Business Code Selection a
- CG on property sold after construction of a house
- Nursing Home Taxability
- CA opted for Form 10IEA mistakenly - Demand raised
- Query on scenario related to FAST DS 2026
- Audit Executive (Remote, India) - Ace Auditing Off
- GST Transaction On Used Clothing


ARTICLESHIP
16 September 2026
Article Assistant
MANUJ SHARMA AND COMPANY
Noida
CA Inter
View Details
Featured
11 September 2026
Audit Executive
RBSM Corporate Advisors Private Limited
Pune
CA
View Details
22 September 2026
Account Assistant
Chirag P Shah & Co. Chartered Accountant
Pune
B.Com
View Details
08 September 2026
Semi-Qualified Assitant
Subrahmanyam & Sivudu CA Firm
Hyderabad
CA Inter
View Details CCI
Pro
CCI
Pro
 CAclubindia