Third Quarter Review of Monetary Policy 2010-11
By
Dr. D. Subbarao
Governor
Introduction
There have been significant changes in the macroeconomic environment since the Second Quarter Review issued on November 2, 2010. Globally, the recovery in the advanced economies appears to be consolidating and expectations of growth during 2011, particularly in the US, are generally being revised upwards. However, inflationary tendencies are clearly visible. Though still subdued in the advanced economies, inflationary pressures in emerging market economies (EMEs), which were already strong, have intensified due to sharp increases in food, energy and commodity prices.
2. The Indian economy has reverted to its pre-crisis growth trajectory, with growth in the first half of 2010-11 estimated at 8.9 per cent. Recent data on agricultural output and service sector indicators suggest that the growth momentum continued in the third quarter. The robustness of growth is also reflected in corporate sales, tax revenues and bank credit, notwithstanding some moderation in the index of industrial production (IIP).
3. Inflation is clearly the dominant concern. Even as the rate itself remains uncomfortably high, the reversal in the direction of inflation is striking. After some moderation between August and November 2010, inflation rose again in December 2010 on the back of sharp increase in the prices of primary food articles and the recent spurt in global oil prices. Non-food manufacturing inflation has remained sticky, reflecting both buoyant demand conditions and rising costs.
4. Against this backdrop, this statement sets out the Reserve Bank’s assessment of the current macroeconomic situation and forward projections. It is organised in four sections. Section I provides an overview of global and domestic macroeconomic developments. Section II sets out the outlook and projections for growth, inflation and monetary aggregates. Section III explains the stance of monetary policy. Section IV specifies the policy measures. This statement should be read and understood together with the detailed review in Macroeconomic and Monetary Developments released yesterday by the Reserve Bank.
I. The State of the Economy
The Global Economy
5. Global growth prospects have improved in recent weeks. The recovery in major advanced economies, which had weakened during Q2 of 2010, regained strength in Q3 of 2010. Real GDP growth in the US, which had moderated from 3.7 per cent in Q1 of 2010 to 1.7 per cent in Q2 of 2010, improved to 2.6 per cent in Q3. Corporate capital spending and retail sales in the US have improved. While uncertainty persists in the Euro area and Japan, the baseline outlook for both is improving. Growth in EMEs has remained strong, supported largely by domestic demand.
6. In advanced economies, the earlier fears of deflation have given way to early signs of inflation. In EMEs, inflation has accentuated significantly in the recent period. Rapidly rising food prices in several economies such as China, India, Indonesia, Brazil and Russia are a major contributory factor. According to the Food and Agriculture Organisation (FAO), international food prices rose by 25 per cent in December 2010 in comparison with the level at the end of 2009. The increase in global food prices has been led by prices of edible oils (55 per cent), cereals (39 per cent) and sugar (19 per cent). Significantly, the FAO expects food prices to further harden during 2011, intensifying global inflationary pressures.
7. These pressures are likely to be reinforced by trends in energy and commodity prices. The crude oil (Brent) price perked from US$ 85 per barrel on November 2, 2010 to US$ 97 per barrel on January 21, 2011. The price of crude (ICE Brent) in the futures market is ruling at US$ 98 per barrel for March 2011 delivery. Many other commodities have seen similar movements. As growth prospects in the US improve, the consequent increase in global demand for energy and commodities will exert further pressure on prices. Already, the 10-year benchmark US government securities yield increased from 2.4 per cent in early October 2010 to 3.4 per cent in mid-January 2011, indicating, among other things, rising inflationary expectations.
The Domestic Economy
8. Real GDP in India increased by 8.9 per cent during the first half of 2010-11, reflecting strong domestic demand, especially private consumption and investment, and improving external demand. Although on a cumulative basis, the IIP grew by 9.5 per cent during April-November 2010, it has been volatile in the current financial year with growth rates ranging between 2.7 per cent and 16.6 per cent. Overall, robust corporate sales, large indirect tax collections, advance tax payments and leading indicators of service sector activity suggest persistence of the growth momentum.
9. On the other hand, the latest quarterly Industrial Outlook Survey conducted by the Reserve Bank during October-December 2010 indicates a marginal moderation in overall business expectations during January-March 2011 from their high level in the previous quarter. The Reserve Bank’s order book, inventories and capacity utilisation survey for July-September 2010 showed a marginal improvement in capacity utilisation in Q2 of 2010-11, while the HSBC Purchasing Managers’ Index (PMI) showed some moderation in the pace of manufacturing sector expansion in December 2010.
10 . Headline inflation, based on year-on-year changes in the wholesale price index (WPI), moderated to a single digit in August 2010 and softened further to 7.5 per cent in November 2010, the lowest level attained during 2010. However, inflation reversed course to rise to 8.4 per cent in December 2010, driven primarily by food and fuel inflation.
11. Year-on-year primary food articles inflation spiked to 13.5 per cent in December from 9.4 per cent in November due to severe supply constraints in respect of some food items. In particular, vegetable prices increased by 22.9 per cent in December 2010 over the previous month’s level. Month-on-month price increases were very high for some vegetables such as brinjals (65 per cent), onions (35 per cent), garlic (26 per cent), cabbage (22 per cent), tomatoes (19 per cent) and potatoes (16 per cent).
12. Year-on-year fuel inflation, which had moderated from 14.4 per cent in May 2010 to 10.3 per cent in November 2010, rose again to 11.2 per cent in December 2010 due to a rise in non-administered domestic fuel prices, reflecting the sharp increase in international prices. In the first fortnight of January 2011, oil marketing companies further raised the prices of petroleum products (petrol and aviation turbine fuel) which will further add to fuel inflation. The year-on-year WPI non-food manufactured products (weight: 55 per cent) inflation, which moderated from 5.9 per cent in April 2010 to 5.1 per cent in September 2010, increased to 5.4 per cent in November, though it softened marginally to 5.3 per cent in December. Significantly, non-food manufactured products inflation continues to remain above its medium-term trend of 4.0 per cent. Moreover, in recent months, the underlying inflation momentum in this segment has been positive.
13. Between November and December 2010, as WPI inflation moved up from 7.5 per cent (year-on-year) to 8.4 per cent, the wholesale price index increased by 1.3 per cent. Of this increase in index, 82 per cent was contributed by primary articles and fuel groups and 18 per cent by the manufactured products group. At a disaggregated level, vegetables alone contributed as much as 40 per cent to the increase in the index in December, followed by mineral oil (13 per cent), condiment and spices (8 per cent) and minerals (7 per cent).
14. Money supply (M3) growth moderated during the year, reflecting slower deposit growth and faster currency expansion which reduced the money multiplier. Several banks raised their deposit rates after the Second Quarter Review of 2010-11 which contributed to a larger deposit mobilisation in December. Consequently, M3 growth increased to 16.5 per cent by end-December 2010, close to the indicative projection of 17 per cent for 2010-11.
15. However, year-on-year nonfood credit growth has been above the Reserve Bank’s indicative projection of 20 per cent since early October 2010, rising to 24 per cent by end-December 2010. The wide gap between credit growth and deposit growth resulted in a sharp increase in the incremental non-food credit-deposit ratio to 102 per cent by end-December 2010, up from 58 per cent in the corresponding period of previous year.
16. Disaggregated data suggest that credit growth, which was earlier driven by the infrastructure sector, is becoming increasingly broad-based across sectors and industries, evidencing growth momentum and demand pressures. Credit flow to the services sector increased significantly for transport operators, tourism, hotel and restaurant and commercial real estate, besides retail housing and personal loans. As regards industry, apart from infrastructure, increase in credit was significant for metals, engineering, textiles, food processing and chemical and chemical products.
17. Rough estimates showed that the total flow of financial resources from banks and non-banks to the commercial sector during April-December 2010 was `9,01,000 crore, up from `6,36,000 crore during the corresponding period of last year. While bank credit to the commercial sector surged, the flow of funds from other sources was lower than last year’s level mainly on account of lower net inflows from foreign direct investment (FDI).
18 . As part of the calibrated exit from the crisis driven expansionary monetary stance, the Reserve Bank increased the repo rate by 150 basis points (bps) and the reverse repo rate by 200 bps during March–November 2010. In addition, the cash reserve ratio (CRR) was raised by 100 bps. In response to these monetary policy measures, scheduled commercial banks (SCBs) raised their deposit rates in the range of 25-250 bps during March 2010 -January 2011 across various maturities, indicating strong monetary policy transmission.
19. The Base Rate system replaced the Benchmark Prime Lending Rate system with effect from July 1, 2010. Several banks reviewed and increased their Base Rates by 25-100 bps between July 2010 and January 2011. Base Rates of 67 banks with a share of 98 per cent in the total bank credit were in the range of 7.5-9.0 per cent in December 2010.
20. Tight liquidity conditions persisted throughout the third quarter of 2010-11. The average daily net injection of liquidity through the liquidity adjustment facility (LAF) increased from around `62,000 crore in October to around `99,000 crore in November and further to around `1,20,000 crore in December, with the peak injection of around `1,71,000 crore on December 22, 2010. While the overall liquidity in the system has remained in deficit consistent with the policy stance, the extent of tightness after the Second Quarter Review of 2010-11 was outside the comfort zone of the Reserve Bank, i.e., (+)/(-) one per cent of net demand and time liabilities (NDTL) of banks. Above-normal government cash balances, which rose from an average of `73,000 crore in October to `1,53,000 crore by the second half of December 2010, contributed to the frictional component of liquidity deficit. However, the widening difference between credit and deposit growth rates coupled with high currency growth accentuated the structural liquidity deficit.
21. The Reserve Bank instituted a number of measures to mitigate the liquidity deficit. First, the statutory liquidity ratio (SLR) of SCBs was reduced from 25 per cent of their NDTL to 24 per cent with effect from December 18, 2010. Second, it conducted open market operation (OMO) purchase of government securities of the order of over `67,000 crore. Third, additional liquidity support to SCBs was provided under the LAF. This facility, which was initially available up to 2 per cent of their NDTL, was brought down to one per cent of NDTL after reduction in the SLR by one percentage point. Fourth, a second LAF window was introduced.
22. Government spending resulted in a reduction of its cash balances during January 2011 (up to January 21, 2011). As a result, the average daily net liquidity injection through the LAF declined from around `1,20,000 crore during December 2010 to around`90,000 crore in January 2011 (up to January 21, 2011).
23. Reflecting the improvement in the tight liquidity conditions, the average daily call rate moderated from 6.7 per cent during December 2010 to 6.5 per cent in January 2011 (up to January 21, 2011). At the longer end, 10-year government security (G-Sec) yield, which had generally remained above 8 per cent during most of October-November 2010 on account of inflationary pressures and persistent liquidity tightness, also softened in the second half of December 2010. However, the yield on 10-year G-sec moved up again to 8.2 per cent by January 21, 2011, reflecting both liquidity conditions and inflationary expectations.
24. Over 95 per cent of the Central Government’s budgeted borrowing programme (net) was completed by January 24, 2011. During the first eight months of 2010-11, the fiscal deficit of the Central Government was less than 50 per cent of the budget estimates. The one-off revenue generated from spectrum auctions, estimated to be around 1.5 per cent of GDP for the year, has been a major contributor to the current improvement on the revenue side.
25. During 2010-11 (up to December 2010), the real exchange rate of the rupee showed a mixed trend. It appreciated by 3.7 per cent on the basis of the trade based 6-currency real effective exchange rate (REER), reflecting both nominal appreciation of the rupee against the US dollar and the higher inflation differential with major advanced countries. However, against broader baskets of 36-currency and 30-currency REER, the rupee depreciated over its March 2010 levels by 0.6 per cent and 2.5 per cent, respectively.
26. On a balance of payments (BoP) basis, the trade deficit widened to US$ 35.4 billion in Q2 of 2010-11 from US$ 31.6 billion in Q1. Coupled with stagnation in invisibles receipts, this led to a widening of the current account deficit (CAD) from US$ 12.1 billion in Q1 of 2010-11 to US$ 15.8 billion in Q2 of 2010-11. In the first half of 2010-11, the CAD expanded to 3.7 per cent of GDP from 2.2 per cent in the corresponding period of last year. Subsequent trade data indicate faster growth in exports vis-a-vis imports which may help improve the CAD in Q3 of 2010-11. However, the sharp increase in global commodity prices, particularly oil, could have an adverse impact on our trade balance going forward. For the year as a whole, India’s CAD is expected to be close to 3.5 per cent of GDP.
II. Outlook and Projections
Global Outlook
Growth
27. With advanced economies showing firmer signs of sustainable recovery, global growth in 2010 is expected to have been less imbalanced than before. While growth in advanced economies may improve, growth in EMEs, which have been the main engine of global economic growth in the recent period, may moderate due to tightening of monetary policy to address rising inflationary concerns and the waning impact of the fiscal stimulus measures taken in the wake of the global financial crisis.
Inflation
28. Even as a large slack persists, inflation has edged up in major advanced economies owing mainly to increase in food and energy prices. Inflation in the Euro area exceeded the European Central Bank’s (ECB) medium-term target for the first time in more than two years in December 2010. Similarly in the UK, the headline inflation has persisted above the target of the Bank of England. In the US, the headline CPI rose to 1.5 per cent in December 2010 from 1.1 per cent in November 2010. Whereas signs of inflation in the advanced countries are only incipient, many EMEs have been facing strong inflationary pressures, reflecting higher international commodity prices and rising domestic demand pressures.
29. Significantly, food, energy and commodity prices are widely expected to harden during 2011, driven by a combination of supply constraints and rising global demand, as the advanced economies consolidate their recovery. This suggests that inflation could be a global concern in 2011.
Domestic Outlook
Growth
30. On the domestic front, the 8.9 per cent GDP growth in the first half of 2010-11 suggests that the economy is operating close to its trend growth rate, powered mainly by domestic factors. The kharif harvest has been good and rabi prospects look promising. Good agricultural growth has boosted rural demand. Export performance in recent months has been encouraging.
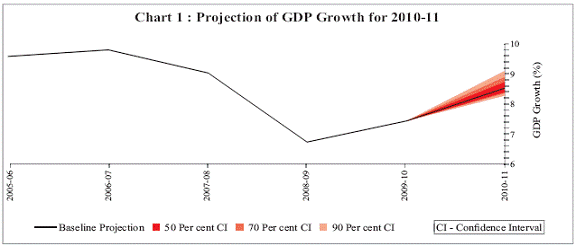
31. With the risks to growth in 2010-11 being mainly on the upside, the baseline projection of real GDP growth is retained at 8.5 per cent as set out in t he Second Quarter Review of Monetary Policy of July 2010 but with an upside bias (Chart 1).
Inflation
32. The moderation in headline inflation observed between August and November 2010 was along the projected trajectory of the Reserve Bank. This trend, however, reversed in December 2010 due mainly to sharp increase in the prices of vegetables, mineral oils and minerals.
33. While the current spike in food prices is expected to be transitory, structural demand-supply mismatches in several non-cereal food items such as pulses, oilseeds, eggs, fish and meat and milk are likely to keep food inflation high. Non-food manufacturing inflation also remains significantly above its medium-term trend of 4 per cent. The Reserve Bank’s quarterly inflation expectations survey, conducted during the first fortnight of December 2010, indicates that expectations of households remain elevated.
34. Going forward, the inflation outlook will be shaped by the following factors. First, it will depend on how the food price situation – both domestic and global – evolves. Domestic food price inflation has witnessed high volatility since mid-2009 due to both structural and transitory factors. A significant part of the recent increase in food price inflation is due to structural constraints. This is reflected in the less than expected moderation in food price inflation even in a normal monsoon year. There has also been a sharp increase in the prices of some food items due to transitory supply shocks. What is more worrying is the substantial increase in pr ice s of sever a l food items even though their production has not been affected. As a result, the usual moderation in vegetable prices in the winter season has not materialised.
35. Notably, high food price inflation is not unique to India. Food prices have spiked in many countries in the recent period. India is a large importer of certain food items such as edible oils, and the domestic food price situation could be exacerbated by the increase in global food prices. This, therefore, poses an additional risk to domestic food price inflation.
36. The second factor that will shape the inflation outlook is how global commodity prices behave. Prices of some commodities rose sharply in the recent period even as the global recovery was fragile. Should these trends continue, they will impact inflation, domestically and globally.
37. The third factor is the extent to which demand side pressures may manifest. This risk arises from three sources, viz., the spill-over of rising food inflation; rising input costs, particularly industrial raw materials and oil; and pressure on wages, both in the formal and informal sectors. The rise in food inflation has not only persisted for more than two years now, the increase has been rather sharp in the recent period. This cannot but have some spill-over effects on generalised inflation, particularly when the growth momentum is strong and both workers and producers are likely to have pricing power. There are indications that, in the corporate sector, the share of wages in total costs is increasing. The indexation of the Mahatma Gandhi National Rural Employment Guarantee Act (MGNREGA) wages will also raise the wage rate in the agricultural sector. Further, besides oil, the prices of some primary non-food articles have risen sharply in the recent period. Since these are inputs into manufactured products, the risk to headline inflation is not only from the increase in non-food items but also because the increase in input costs will ultimately impact output prices. As the output gap closes, corporates will also be able to sustain higher output prices. In the absence of commensurate increase in capacity, there is the risk of demand side pressures accentuating.
38. In the Second Quarter Review of November 2010, the Reserve Bank set out the baseline projection of WPI inflation for March 2011 at 5.5 per cent, based on the new WPI series (2004-05=100). The Mid-Quarter Review of December 2010 indicated that the risks to inflation going forward were largely on the upside. Some of these risks have materialised as reflected in the increase in the prices of metals and non-administered fuel. There have also been some transitory supply shocks as reflected in the sharp increase in vegetable prices. In addition, petroleum and aviation turbine fuel prices were raised in early January which will add 9 bps to WPI inflation.
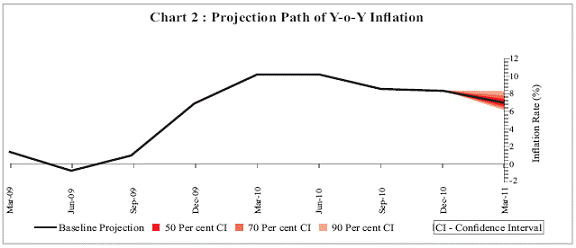
While the impact of transitory factors is expected to wane, the price pressures on account of demand-supply imbalances in respect of some commodities will persist. Considering the increase that has already occurred and the emerging domestic and external scenario, the baseline projection of WPI inflation for March 2011 is revised upwards to 7.0 per cent from 5.5 per cent (Chart 2).
Monetary Aggregates
39. While the year-on-year money supply (M3) growth at 16.5 per cent in December 2010 was close to the indicative projection of 17 per cent, non-food credit growth at 24.4 per cent was much above the indicative projection of 20 per cent. Credit expansion in the recent period has been rather sharp, far outpacing the expansion in deposits. Rapid credit growth without a commensurate increase in deposits is not sustainable.
40. As a result of injection of primary liquidity of over `67,000 crore through OMO auctions since early November 2010, the structural liquidity deficit in the system has declined significantly. While the Reserve Bank will endeavour to provide liquidity to meet the productive credit requirements of a growing economy, it is important that credit growth moderates to conform broadly to the indicative projections. This will prevent any further build-up of demand side pressures. Accordingly, the projection for 2010-11 of M3 growth has been retained at 17 per cent and that for non-food credit growth at 20 per cent. As always, these numbers are indicative projections and not targets.
Risk Factors
41. The growth and inflation projections as outlined above are subject to several risks.
i) Food inflation has remained at an elevated level for more than two years now. It is not only that the moderation in food price inflation as expected during a normal monsoon year has not occurred to the extent expected, but also that there has been sharp unusual increase in prices. It is also significant that food inflation is not confined to a few items which were affected by unseasonal rains in some parts of the country but is fairly widespread across several food items. The inflation rates for primary articles and fuel items have risen sharply. Inflationary expectations remain at elevated levels. As high food inflation persists, the prospect of it spilling over to the general inflation process is rapidly becoming a reality.
ii) Non-food manufacturing inflation is persistent and has remained sticky in recent months as several industries are operating close to their capacity levels. Imports as a means to supplement domestic availability for many commodities will become less of an option as global growth consolidates and capacity utilisation increases. This may accentuate demand side pressures.
iii) India’s CAD has widened significantly. Although recent trade data suggest moderation of the trade deficit in the latter part of the year, overall CAD for 2010-11 is expected to be about 3.5 per cent of GDP. A CAD of this magnitude is not sustainable. Further, commodity prices, which rose sharply even when the global recovery was sluggish, may rise further if the global recovery is faster than expected. This has implications for both the CAD and inflation. There is, therefore, a need for concerted policy efforts to diversify exports and contain the CAD within prudent limits.
iv) Apart from the level of CAD, financing of CAD also poses a risk. Global growth prospects have improved significantly in the recent period. Should global recovery be faster than expected, it may also have implication for the financing of CAD. Capital flows, which so far have been broadly sufficient to finance the CAD, may be adversely affected. Faster than expected global re cover y may enhance the attractiveness of investment opportunities in advanced economies, which may impact capital flows to India. This may increase the vulnerability of our external sector. Hence, the composition of capital inflows needs to shift towards longer-term commitments such as FDI.
v) The recent improvement in the fiscal situation has been mainly the result of one-off revenue generated from spectrum auctions. The Government also had the benefit of disinvestment proceeds, which may continue to occur for some more time. However, fiscal consolidation based on one-off receipts is not sustainable. As emphasised in the Second Quarter Review of November 2010, fiscal consolidation is important for several reasons, including the fact that monetary policy works most efficiently while dealing with an inflationary situation when the fiscal situation is under control. Apart from this, the commodity price developments that have been referred to earlier pose significant risks for fiscal consolidation in the year ahead. Rising oil prices will impact prices of both petroleum products and fertilisers. If the Government chooses to restrict the pass-through to consumers and farmers, it will have to make adequate budgetary provisions, which will constrain its ability to reduce the fiscal deficit. If it does not, either fiscal credibility will be undermined or inflationary expectations will be reinforced by the likelihood of higher prices of these key inputs, both of which will further complicate inflation management.
vi) The combined risks from inflation, the CAD and fiscal situation contribute to an increase in uncertainty about economic stability that consumers and investors will have to deal with. To the extent that this deters consumption and investment decisions, growth may be impacted. While slower growth may contribute to some dampening of inflation and a narrowing of the CAD, it can also have significant impact on capital inflows, asset prices and fiscal consolidation, thereby aggravating some of the risks that have already been identified.
III. The Policy Stance
42. The Reserve Bank began exiting from the crisis driven expansionary monetary policy as early as in October 2009. Since then, it has cumulatively raised the CRR by 100 bps, and the repo and reverse repo rates under the LAF by 150 and 200 bps, respectively. As the overall liquidity in the system has transited from a surplus to a deficit mode, the effective tightening in the policy rate has been of 300 bps. The monetary policy response was calibrated on the basis of India specific growth-inflation dynamics in the broader context of global uncertainty.
43. While the Reserve Bank decided to leave the policy rates unchanged in the Mid-Quarter Review of December 2010, developments on the inflation front since then have reinforced the already elevated concern in this regard. Accordingly, our monetary policy stance for the remaining period of 2010-11 has been guided by the following considerations:
-
First, since the Second Quarter Review of November 2010, inflationary pressures, which were abating until then, have re-emerged significantly. Primary food articles inflation has risen again sharply after moderating for a brief period. Non-food articles and fuel inflation are already at elevated levels. Importantly, non-food manufacturing inflation has remained sticky. There are, therefore, signs of rapid food and fuel price increases spilling over into generalised inflation. As it is, there is some evidence of rising demand side pressures which are reflected in rapid bank credit growth, robust corporate sales and rising input and output prices, and buoyancy in tax revenues. The need, therefore, is to persist with measures to contain inflation and anchor inflationary expectations.
-
Second, global commodity prices have risen sharply which has heightened upside risks to domestic inflation.
-
Third, growth has moved close to its pre-crisis growth trajectory as reflected in the 8.9 per cent GDP growth in the first half of 2010-11, even in the face of an uncertain global recovery.
-
Fourth, the global economic situation has improved in the recent period. The uncertainty with regard to global recovery, which was prevailing at the time of the Second Quarter Review, has reduced with the US economy showing signs of stabilising. Although uncertainty continues in the Euro area, there is an overall improvement in the global growth prospects.
44. To sum up, the current growth-inflation dynamics in the last few weeks suggest that the balance of risk has tilted towards intensification of inflation. In this scenario, the stance of the monetary policy is intended to :
-
Contain the spill-over of high food and fuel inflation into generalised inflation and anchor inflationary expectations, while being prepared to respond to any further build-up of inflationary pressures.
-
Maintain an interest rate regime consistent with price, output and financial stability.
-
Manage liquidity to ensure that it remains broadly in balance, with neither a surplus diluting monetary transmission nor a deficit choking off fund flows.
45. It is important to emphasise that the role of monetary policy in the current inflationary situation is confined to containment and prevention of food and energy prices from spilling over into generalised inflation and anchoring inflation expectations. While energy prices are driven by global developments, the food price scenario is primarily a reflection of persistent structural constraints in the domestic agricultural sector. While these have been known and debated upon for a long time, the recent price dynamics highlight the need for rapid action to increase the output of a number of products, the demand for which is being driven by changing consumption patterns reflecting increasing incomes. Unless meaningful output enhancing measures are taken, the risks of food inflation becoming entrenched loom large and threaten both the sustainability of the current growth momentum and the realisation of its benefits by a large number of households.
46. Another challenge to effective management of inflation by monetary policy arises from the persistence of a large fiscal deficit. While the Government may succeed in raising receipts, both from high tax buoyancy and one-off sources, the real measure of fiscal consolidation lies in improving the quality of expenditure. If the Government is able to commit more resources to capital expenditure, it will help deal with some of the bottlenecks that contribute to supply-side inflationary pressures. With reference to revenue expenditure, while large and diffused subsidies may contribute in the short term to keeping supply-side inflationary pressures in check, they may more than offset this benefit by adding to aggregate demand.
IV. Policy Measures
Monetary Measures
47. On the basis of the current assessment and in line with the policy stance as outlined in Section III, the following monetary policy measures are announced.
Bank Rate
48. The Bank Rate has been retained at 6.0 per cent.
Repo Rate
49. It has been decided to:
-
increase the repo rate under the liquidity adjustment facility (LAF) by 25 basis points from 6.25 per cent to 6.5 per cent with immediate effect.
Reverse Repo Rate
50. It has been decided to :
-
increase the reverse repo rate under the LAF by 25 basis points from 5.25 per cent to 5.50 per cent with immediate effect.
Cash Reserve Ratio
51. The cash reserve ratio (CRR) of scheduled banks has been retained at 6.0 per cent of their net demand and time liabilities (NDTL).
Liquidity Management Measures
52. On the basis of an assessment of the current liquidity situation, it has been decided to extend the following liquidity management measures:
i) The additional liquidity support to scheduled commercial banks under the LAF to the extent of up to one per cent of their net demand and time liabilities (NDTL), currently set to expire on January 28, 2011, is now extended up to April 8, 2011. For any shortfall in maintenance of the SLR arising out of availment of this facility, banks may seek waiver of penal interest purely as anad hoc measure.
ii) The second LAF (SLAF) will be conducted on a daily basis up to April 8, 2011.
53. The Reserve Bank will constantly monitor the credit growth and, if necessary, will engage with banks which show an abnormal incremental credit-deposit ratio.
Expected Outcomes
54. These actions are expected to:
(i) Contain the spill-over from rise in food and fuel prices to generalised inflation.
(ii) Rein in rising inflationary expectations, which may be aggravated by the structural and transitory nature of food price increases.
(iii) Be moderate enough not to disrupt growth.
(iv) Continue to provide comfort to banks in their liquidity management operations.
Guidance
55. Current growth and inflation trends warrant persistence with the anti-inflationary monetary stance. Looking beyond 2010-11, the Reserve Bank expects domestic growth momentum to stabilise, though the GDP growth rate may decline somewhat as agriculture reverts to its trend (assuming a normal monsoon). Inflation is likely to resume its moderating trend in the first quarter of 2011-12, but several upside risks are already visible in the global environment and more may surface domestically. The monetary stance will be determined by how these factors impact the overall inflationary scenario. For the fiscal consolidation process to be credible and effective, it is important that apart from augmenting revenue, the composition and quality of expenditure improves. Any slippage in the fiscal consolidation process at this stage may render the process of inflation management even harder.
56. The frictional liquidity shortage is expected to ease as government balances adjust to the expenditure schedule. However, banks need to focus on the underlying structural cause of liquidity tightness arising out of the gap between the credit and deposit growth rates.
Mid-Quarter Review of Monetary Policy
57. The next mid-quarter review of Monetary Policy for 2010-11 will be announced through a press release on March 17, 2011.
Monetary Policy 2011-12
58. The Monetary Policy for 2011-12 will be announced on Tuesday, May 3, 2011.


 CAclubindia