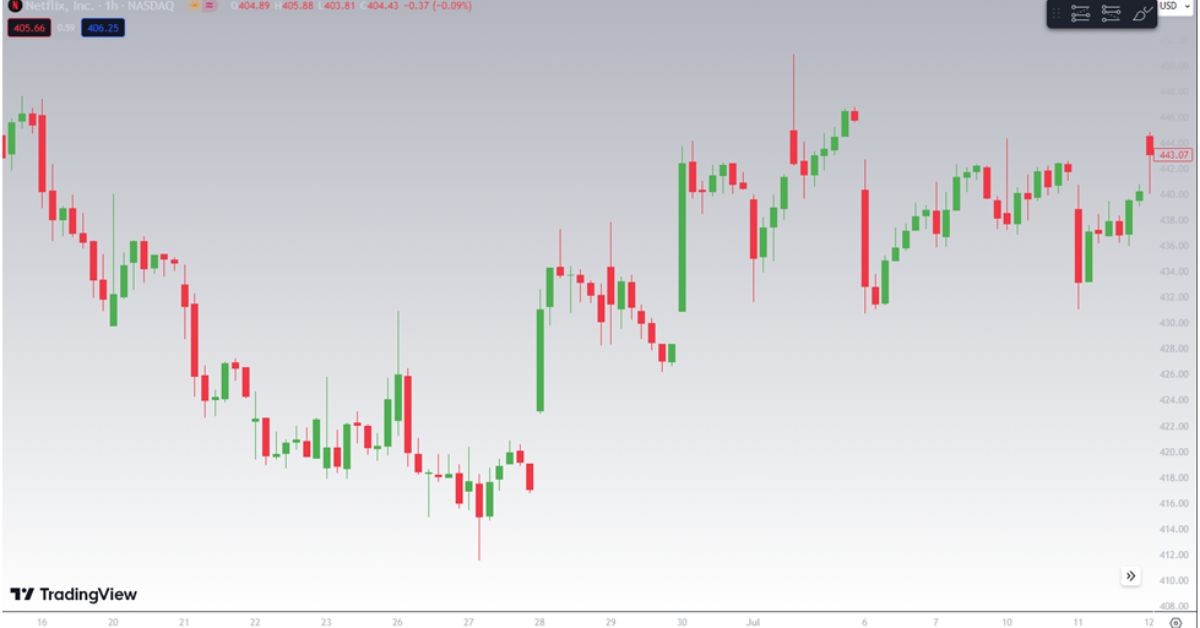
If you're serious about making it in the trading world, you have to know candlestick charts inside out. It's non-negotiable. Think of it like an essential skill, same like dribbling in basketball or cooking in a restaurant. In trading, it's all about being aware and conscious of what information the markets are displaying you through these candlesticks. You get this right, and you're not just playing the game- you're mastering it.
What are Candlestick Charts?
Originating in 18th-century Japan, candlestick charts have been around longer than the United States itself. It's a tried-and-true technique invented by a rice farmer called Homma who used charts and candlesticks to analyze the price of rise, supply and demand and the rice traders' emotions.

Anatomy of a Candlestick
The Body - The Heart of the Action
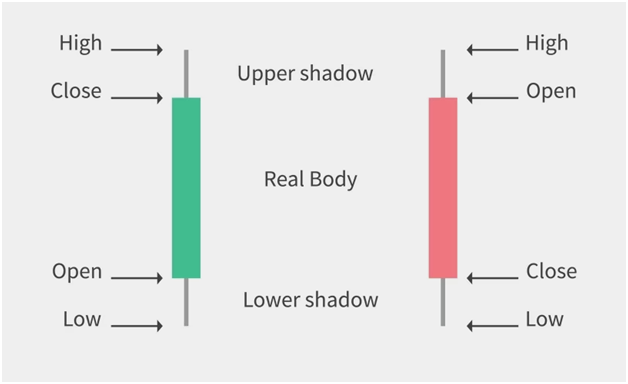
The body of a candlestick is the essence of the battlefield between buyers and sellers. Imagine it as a boxing ring where a constant tussle happens. If the closing price is higher than the opening price, you've got yourself a bullish body, usually colored white or green. On the other hand, if it's lower, we're talking bearish, typically marked in black or red. That's your cue to either exit the market or short sell it.

The length of a candlestick's body gives very important clues as well. It's practically a mood ring for the market. Big body? Strong emotions, high activity. Small body? In decision, or everyone's taking a lunch break. Knowing this is like knowing if the party is full of energy or a total snoozefest before even walking in. When you notice large candlestick bodies on a chart, prepare to take action because there is momentum and money to be made!
The Wicks - The Untold Stories
The wicks - or shadows, tails, whatever you want to call them- these are like the whispers, the rumors, the "almosts" of the market. The wicks show you how far prices ventured before snapping back. It's like hearing gossip about what almost happened but didn't. If you see a long upper wick, for instance, that tells you the bulls tried to push it, they really did, but couldn't sustain it. Similarly, a long lower wick shows the bears took a swing but ultimately failed.
And don't for a second underestimate the wick. You see a small body with long wicks? That's volatility knocking on your door. That's the market saying, "Hey, I'm all over the place; you sure you wanna dance?" And as a wise and professional trader, you may want to pass on this invitation.
The Real World - Where Body Meets Wick
Now, here's where the magic happens: when you combine what the body and wicks are telling you. Are the wicks short and the body long? You've got action, whether it's bullish or bearish. Are both wicks extended? Brace yourself; there is indecision in the market and it's better to stay on the sidelines and wait for the storm to pass.
So, there you go. You're not just staring at some stick figures on a chart anymore. You're watching an epic saga unfold, one candlestick at a time. Know what each element means, and you're not just a spectator; you're a strategist in the world's most dynamic battlefield, the financial market.
How to Master Candlestick Analysis
Candlestick Patterns
Candlestick chart patterns are the foundation of technical analysis. They consist of candlesticks of different shapes, sometimes a combination of more than just one candlestick, that help traders pinpoint market entries and exits with high accuracy.
Bullish Patterns
Bullish Engulfing, Hammer, Morning Star- these are your allies in the bullish environment. This is when you become the alpha predator, recognizing opportunities most traders are too blind or too lazy to spot.
Bearish Patterns
Shooting Star, Evening Star, Hanging Man- these are the omens of a downturn. Are you just going to stand there or take necessary actions? These patterns are your last-minute exits, your final warning signs before the proverbial fan gets hit. You can also use bearish candlestick patterns to short sell the market but it requires far more skill to master this technique because in a bear market, the "sell panic" creates higher volatility and you have to be more careful.
Context and Confirmation
Context matters. Candlestick patterns need to be read in the right setting and confirmed before you bet your hard-earned money on them. If you're not factoring in the larger market trends, you might as well be rolling dice in a casino. Candlestick patterns work amazingly well but you need to learn in which market cycle they work best and for which asset they repeat the most.
Combining with Other Technical Indicators
It's not just about candlesticks. It's like expecting to win a boxing match with a good jab but no cross, hook, or uppercut. You need to mix in other indicators like moving averages or RSI to get a holistic view. To really hit home, you need to combine forces and become the total package. Adding more technical indicators in your strategy will give you more confirmation that you decision is correct and help you avoid false signals in the market.
Timeframe Selection
And here's the part where many beginners especially get it wrong: timeframe analysis. If you're peeping at a 1-minute chart for long-term investments, you're off the mark and doomed to fail. It's like bringing a knife to a gunfight. Understand what timeframes suit your trading style. For intra-day traders aiming to capitalize on short-term market fluctuations, the 1-minute or 5-minute charts are ideal. On the other hand, swing traders should focus on longer timeframes such as the 1-hour, 4-hour, or daily charts for the most accurate insights.
Conclusion
The gloves are off. Are you here to make money long-term, or are you here to gamble? Are you the Warren Buffet who continually educates himself, or are you the guy who thinks he can wing it, trade "the news" or follow trading signals off Telegram? If you don't have a plan, then you're planning to fail. It's that straightforward.
So, after reading this hard truth, do you think you have what it takes to be successful in trading? Are you prepared to dive deep into the nitty-gritty of candlestick charts, crunch the numbers, put in the hours, and study the markets like a final exam?
If you're still here, congrats. You've got the mindset. Now, it's time to bring that mindset to life. Start practicing, start analyzing, and never stop learning. Your future millionaire self will thank you.


 CAclubindia
