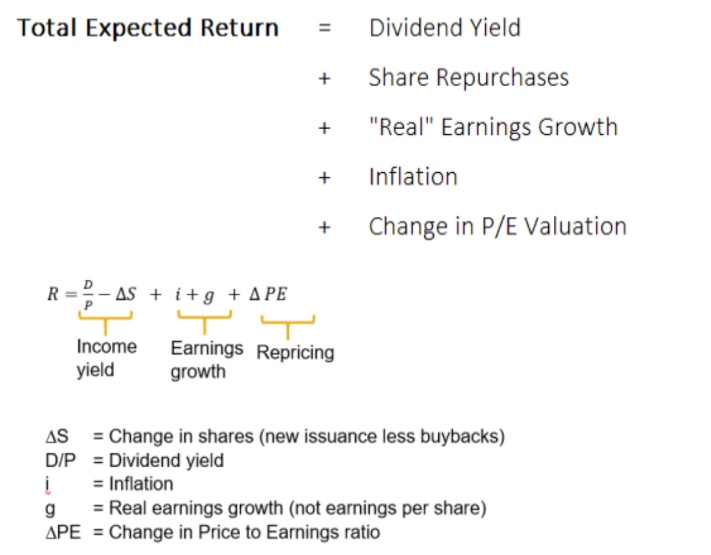
This article covers the Grinold Kroner Model to predict the stock,a sector or the market returns of the equity.
1. Overview
- As per Grinold Kroner model expected return on the stock comprises of 5 factors. It is the summation of all the 5 factors.
- The Grinold-Kroner model can be used to estimate returns for a single stock, a sector, or the market in general. Knowing the factors contributing to total expected returns in the Grinold-Kroner model can help investors understand what is driving their returns. In this article, we will introduce investors to the Grinold-Kroner model and use it to get a sense of why total returns for the Infosys might be around 9.78% annually over the next 5 years.
- These 5 factors can be further categorised into 3 criteria i.e
- Based on Economy- Real Earning growth rate of the corporate +Expected Inflation
- Based on income yield to investors from the stock - Dividend yield to investors +Share buyback by the co.
- Change in PE ratio of the stock

2. EXAMPLE
Lets understand above concept with a simple example in the indian context.
Lets predict next 5 years average return of Infosys with the following imagionary data.
- Indian Economy is expected to grow at a real rate of 5% p.a ,Infosys real growth rate is predicted to be above 2% of country real GDP, expected inflation of the country is 4% p.a. Dividend yield on the infosys stock is 2.08%, Share buy back by infosys is predicted to be 2% , current P/E ratio of infosys is 28.51 and median P/E is expected to be 27.
Answer -
5 years Average return on infosys is summation of the following-
- Real Earning growth rate = 5%+2%
- Expected Inflation = 4%
- Dividend yield = 2.08%
- Share buyback = 2%
- Change in P/E ratio
{(27-28.51)/28.51}*100 = -5.30%
EXPECTED RETURN = 9.78%
(Sum of above 1 to 5)

3. Further Explanation of the above 5 factors
(i) Real Earning growth rate of the corporate
- Real Economic Growth Rate of the country is the rate at which a nation's Gross Domestic product (GDP) changes/grows from one year to another. It is the sum of Labour growth and the labour productivity of the country. Long term Labour productividy in the economy come from advancement in the technology.
- In the short term real earning growth rate of a specific co. may be higher or lower than the real growth rate of the country. But in long term real growth rate of the corporate equal to real GDP growth of the country.
(ii) Expected Inflation
- Companies have the ability to adjust the prices of their products for inflation. This inflation hedge is one of the benefits equities have over bonds. We want to look at inflation by itself to understand what portion of growth is due to the company growing and what is due to overall rising prices in the economy.
(iii) Dividend yield
- This is the current dividend yield on the stock or index (before accounting for growth). This is the way of returning net income to the shareholders.
(iv) Share Repurchase
- Due to higher rate of taxation on dividend,company return to shareholders in the form of share repurchase or buyback.
(v) Change in P/E Valuation
- Over the horizon period being analyzed any change in the valuation of the stock or overall market can have a large effect on total returns. For example, if P/E levels are expected to decline from 20x to 16x over the 5 year time period, then this would imply a 20% decrease in valuations (20% = 16x / 20x -1). This change in valuations over the 5 year period would then average out to 4% decreases in valuation per year (4% = 20% / 5 years).
4. Pro and cons. Of the model
(i) Pro
- Easy to understand
- Factors easy to collect and interpret.
- Model takes into accounts Micro as well as macro variables.
(iii) Cons
- Model do not work well in crisis time or in the time of external shocks in the economy.
- Individual stocks suffers from Idiosyncratic risk(i.e stock specific risk that is hard to quantify.)
5. Conclusion
- Most of the inputs to the Grinold–Kroner model are fairly readily available. Economic growth forecasts can easily be found in investment research publications, reports from such agencies as the IMF, the World Bank, and the OECD (Org. Of Economic Cooperation Development )
- It is simple way to forecast long term return on stock, sector or the market as a whole with easy available input data


 CAclubindia
