As we all know, financial ratios are used to analyze the financial performance of a company. For this purpose many types of ratios are used like liquidity ratio which tells us the ability of a company to pay back its short term obligations and Debt ratio which tells us the mix of equity and debt. Let’s discuss each type of ratio and what purpose they serve in analyzing the statements.
LIQUIDITY RATIOS
Definition – This ratio tells us that how quickly the company is able to pay off its current obligations (due within 1 year). Whether current assets like cash is enough to pay off current liabilities or not.

What is it?
Current Assets include Cash, Stock, Receivables, Marketable securities (securities than can be converted into cash quickly at a reasonable price).
Current Liabilities include Payables, and other short term obligations (due within 1 year).
What is it showing?
It shows that company’s current assets are twice its current liabilities, so it will be able to meet its current obligations with ease.
Is it free from deficiencies?
Not always, suppose the company has very little amount of cash and all stock turnaround time (time to convert stock into cash) of which is 3 months and liabilities include short term loan maturing in 1 month time then this position actually create a scarcity to pay back the bank. Thus, it would be financially not sound.

What is it?
Liquid assets are Current assets less Inventory and other assets which are difficult to be easily converted into cash.
What is it showing?
It eliminates the problem we faced in Current ratio. It is conservative. It gives a clearer picture by removing the inventory and other assets which are not easily convertible. It focuses on core liquidity of the company.
Is it free from deficiencies?
Not always, like current ratio, account receivables may have higher turnaround time which may create the same problems.

What is it?
This ratio includes only cash and short term securities as current assets.
What is it showing?
This eliminates the problem faced in current and quick ratio. By including only cash and securities, this ratio ensures the ability of the company to pay off its current liabilities.
Is it free from deficiencies?
This ratio is the least used because no company can carry its business without stock. Large amount of cash also depicts that company is performing poor in investing its surplus cash reserves.
PROFITABILITY RATIOS
Definition – Profitability ratios shows that how better the company is using its assets to generate profits.

What is it?
Gross profit means net sales less direct expenses i.e. raw material, labor, and factory overhead.
What is it showing?
It shows what percentage of gross profit is earned per rupee of net sales. If ratio is 50% it means that for every 100 Rs. spent, gross profit made is Rs. 50.
Is it free from deficiencies?
This ratio ignores other important day to day expenses like selling, administration etc. So, this ratio is least reliable among other margin ratios.

What is it?
Operating profit means Gross profit less day to day expenses like selling and admin expenses, and other operating expenses.
What is it showing?
It shows that what percent of operating profit is earned per rupee on Net sales. If ratio is 40% it means that for every 100 Rs. spent, operating profit made is Rs. 40.
Is it free from deficiencies?
This ratio is preferred in investment analysis but it may not reflect the current extraordinary circumstances that company faced like loss by fire, theft etc. So it may not be more reliable.

What is it?
Net profit means operating profit less non-operating expense (extraordinary losses like loss from fire, and other losses like loss on account of asset sale, interest expense) while adding non-operating income (extraordinary income like gain on foreign exchange, and other income like sale of entity and sale of assets).
What is it showing?
It shows that what percent of Net profit is earned on per rupee of sale. If ratio is 30% it means that for every 100 Rs. spent, Net profit made is Rs. 30.
Is it free from deficiencies?
This is the most reliable ratio used in investment analysis. But as this ratio also accounts extraordinary items, this when used with other margin ratios provides a clearer picture of the company’s bottom line.

What is it?
Average total assets means the average of opening and closing assets of the company.
What is it showing?
It shows that how optimally the company is using its assets to generate profit. If the ratio is 5% it means that for every 100 Rs. of assets, net profit of Rs. 5 is made.
Is it free from deficiencies?
Total assets may include those assets which are not used for years yet not sold, thereby decreasing the ratio and also on the other side, extraordinary gains and losses like fire may increase or decrease the ratio significantly. Also, value of long term asset is shown at book value ignoring inflation and market value. So, particulars must be analyzed while taking investment decisions.

What is it?
Average shareholders’ equity means the wealth of the shareholders which includes retained earnings and free reserves.
What is it showing?
It shows that how well a company is utilizing the funds of its shareholders’ to generate profit. If the ratio is 10% it means that with every 100 Rs. of shareholders’ funds, Rs. 10 is made.
Is it free from deficiencies?
Higher ratio is only beneficial when the earnings are not distributed but reinvested. Growth model shows that if dividend is distributed then growth rate reduces. Say 30% earnings are distributed then 70% growth of the ratio is possible i.e. if Rs. 3 is given as dividend then growth can only be made 70% of 10% = 7% growth is possible.
On the other hand, from the investors’ point of view, higher ROE means the price of share will increase so she has to pay more to buy shares. As the ROE is used for the purpose of reinvestment of funds, Earning per share (EPS) must be considered when dealing in shares.

What is it?
Earnings before interest and tax is simply the net profit in which tax and interest are added back. Capital employed include both shareholders’ funds and Debts liabilities like loans, public deposits etc.
What is it showing?
It shows that how efficiently the company is using shareholders’ funds along with debts to generate profit.
Is it free from deficiencies?
Value of assets are shown at book value ignoring inflation and market value. So, the increase in ratio may not show that company is actually earning that return.
DEBT RATIOS
Definition – There ratios tell the mix of debt and equity and ability of the firm to pay its debts.

What is it?
Total assets include current and long term assets. Debt liabilities include loan taken from bank or any from any outside source, and other current liabilities.
What is it showing?
It shows that how much percent of the total assets is the long term debt. The higher the ratio, means the liabilities towards debt is higher thereby interest burden and liability of repayment which increases and vice versa.
Is it free from deficiencies?
Liability part of ratio contains current debt which is used to finance day to day activities and taking those liabilities into account may not provide reliable stats. Debts should be bifurcated into long and short term before taking investment decisions.
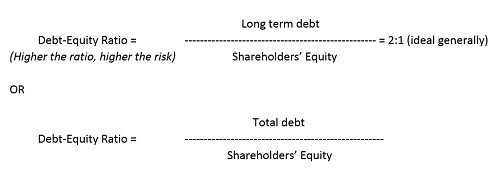
What is it?
Different types of debt equity measures can be used which include 2 mostly used types - long term debt and total debts as a comparison.
What is it showing?
It shows the number of times the debt is more/less than equity. If the ratio is 2:1 then it shows that for every 100 Rs. of shareholders’ funds, Rs. 200 worth of debt is taken.
Is it free from deficiencies?
Total debt as comparison may not be reliable for the same reason as stated above in debt ratio.

What is it?
As differentiated from other debt ratios, it is a comparison of long term debt with total funds available i.e. long term debt and equity.
What is it showing?
It shows that how efficiently the company is using its leverage capacity to generate income. It simply tells us the percentage of debt attributed towards working of the company.
Is it free from deficiencies?
This ratio is most reliable of other debt ratios. It excludes current debt liabilities and focuses on long term risk. At the same time, too low ratio raises questions on the company’s credit worthiness which may be hurdle in securing loans from banks. At the same time too low ratio also shows not so good use of leverage by the company.
Note: Leverage means the ability of the company to multiply its gains or losses. Here it means the use of the company to use debt to multiply return on shareholders’ fund (as debt increases, more investment, more profit thereby more return on each unit of shareholders’ equity).

What is it?
Annual interest expense is the interest liability created towards debt. Simply, interest payments.
What is it showing?
It shows the ability of the company to pay off its interest expense out of profit generated. If the ratio is 2.5:1 then it means that the company has Rs. 25 to pay interest of Rs. 10 leaving it with profit of Rs. 15 before tax.
Is it free from deficiencies?
Earnings before interest and tax includes depreciation and amortizations which is not a cash flow but a non-cash deduction out of company’s profit. So Earnings before interest, tax, depreciation and amortization would be more reliable as it tells us the actual cash flow to make interest payments. Say the depreciation charged is Rs. 20 then the company actually has Rs. 45 to pay interest of Rs. 10 which will increase ratio to 4.5:1 instead of 2.5:1.

What is it?
Total debt service includes interest/lease payment as well as the principal payments.
What is it showing?
Higher ratio shows that the company has plenty of income to pay back its total debt service and vice versa. If the ratio is 0.6:1 then it would mean that the company can pay 60% of its debts.
Is it free from deficiencies?
This is a reliable ratio except the same deficiency as the one mentioned above in the interest coverage ratio (depreciation and amortization).
TURNOVER RATIOS
Definition – Turnover ratios compares different variables and shows how many or how much time will it take to convert one asset into other asset like stock into cash. Turnover ratios are unlimited. One can measure any one particular with another and calculate the time taken. I will be discussing 2 important ratios which are widely used.

What is it?
It is to be noted that total average assets is the average of opening and closing assets of the company.
What is it showing?
It shows how efficiently the assets of the company is used to generate sales. If the ratio is 3:1 then it means that for every 100 Rs. of fixed asset, Rs. 300 worth of sales are made.
Is it free from deficiencies?
Before using this ratio, it must be known that in what type of industry it is being used. For asset intensive businesses like manufacturing units’ ratio would be lower than the type of less asset-intensive business like IT sector or consulting sector the ratio of which would be higher.

What is it?
Cost of goods sold is Cost of production + opening stock of finished goods – closing stock of finished goods.
Account receivables means debtors.
Net credit sales means the sale which is done as an interest free sale to the purchaser for a specified time.
Conversion period means that how much days will be required to convert inventory and receivables into cash.
What is it showing?
Inventory turnover ratio – It shows that what percentage of goods are sold out of the available stock. Too low ratio shows poor sales performance and too high shows that inadequate level of inventory is available and can fall short of the stock anytime soon.
Receivable turnover ratio – It shows that net credit sales is what percentage of receivables. Higher ratio indicates that either receivables are low (business on cash basis) or that business is efficient in collection whereas a lower ratio indicates that business is performing not so good in credit collection and should reassess its policy of giving credit.
Conversion period – Lower conversion ratio is better as it shows that company is able to realize cash fast as opposed to higher ratio which shows that company debtors has potential to go as bad debts and poor inventory conversion period shows that stock is piling up without any significant sale.
Note: Cash Conversion Cycle can be computed as Inventory turnover period + Receivables turnover period + Payables turnover period shows the net period in which the company will be deprived of its cash resources.
MARKET RATIOS
Definition – Market ratios are used to assess the return on shares, dividend returns, market value of shares and other particulars related to shares.
What is it?
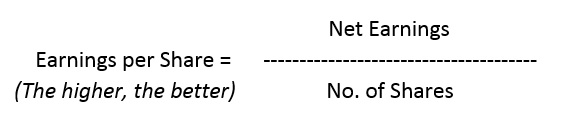
Net earnings is the earnings available for equity shareholders which is net profit after deducting any dividend on preference shares.
No. of shares is the no. of shares outstanding.
What is it showing?
It shows that how much a company is earning per unit of share. If the ratio is 10:1 then it means that company is earning Rs.10 for every unit of equity share. The higher the ratio would be, the better earnings will be there for shareholders.
Is it free from deficiencies?
This ratio may be biased and manipulated for a particular year when there is any extraordinary income or expense like buy back of shares.

What is it?
Dividend means amount paid to shareholders out of earnings.
What is it showing?
It shows that what percentage of earnings is retained and what amount is paid. If dividend payout ratio is 40% it means that out of earnings of Rs. 100, only Rs. 40 is paid out to shareholders and rest Rs. 60 is retained by the company for future growth.
Different investors have different preferences for dividend payout rate.

What is it?
Market price per share is the current price of the share as quoted in the stock exchange.
What is it showing?
It shows that how much an investor is willing to pay for each rupee of earnings. If the Price-Earnings ratio is 10:1, it means that an investor will pay Rs. 10 for Re.1 of earnings. If the ratio is high it means that investors have trust in the company’s growth and she is willing to buy shares at high prices.
Is it free from deficiencies?
It suffers from the same deficiencies as the ones of earnings per share due to earnings being easily manipulated.

What is it?
Yield means net return.
What is it showing?
It shows the yield generated per share. If the ratio is 15% then it means that 15% yield is generated on one share. High ratio may indicate that market price of share is undervalued and lower ratio indicates that market price of share is overvalued.
Conclusion :- So, you have known till now the important ratios used in the finance world and their importance. This is the best possible presentation I could have done in as concise manner as possible. Kindly comment if any errors or omission with the correct info.
Chiranjiv Kumar


 CAclubindia